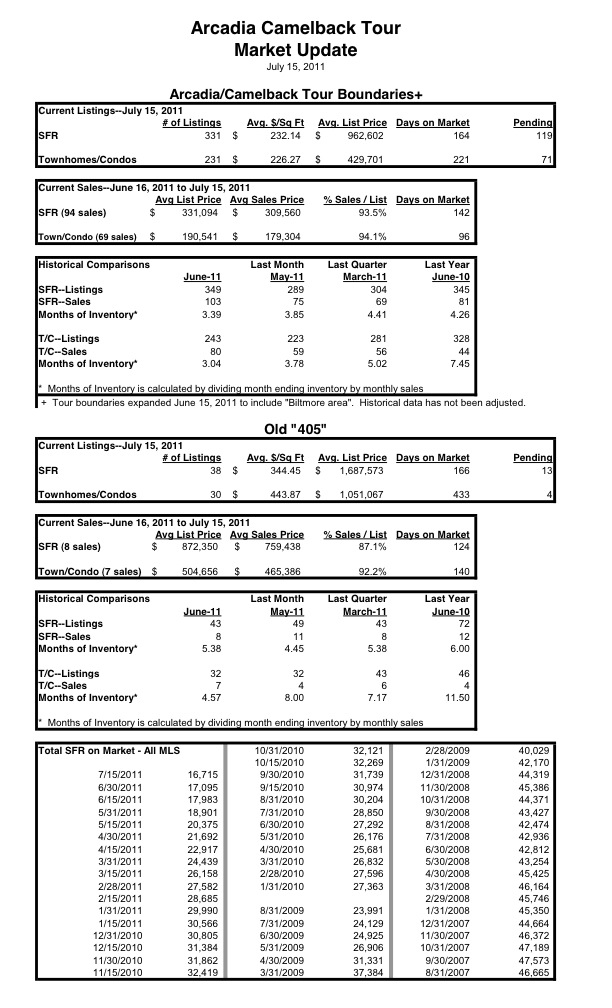
See the latest Arcadia Sales Statistics below! Regarding the overall market, another inventory drop to under 14,000 Single Family Homes currently available.
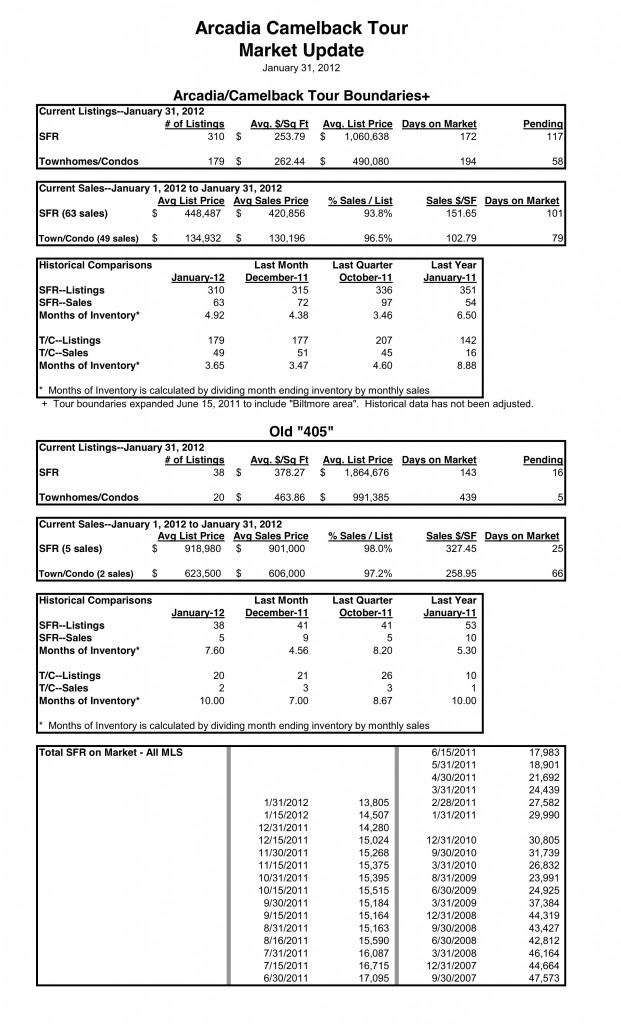
Latest Arcadia Stats
Distressed Comps?
A Note on Distressed Comps
Every central phoenix neighborhood, especially places like Arcadia and the Phoenix Historic Districts, can have a wide price range of listings and recent sales, all within blocks of each other. A common complaint I hear from concerned homeowners is “ugh, my neighbor’s house was just foreclosed on”…or “there are three Short Sales in my neighborhood, I’ll never be able to get what my house is worth if I try to sell in this market.”
The short answer is that it depends.
Short sales are generally not considered to be arms-length transactions by appraisers because the agreed upon sales price has been influenced by factors beyond market value. Appraisers should try to avoid them, but if there are no other sales to use, short sales can be included if appropriately identified. “Appraisers should put little or no emphasis on short sales unless they have studied the sales, discussed them at length with the parties involved and determined if they were in fact arms-length,” says a local appraisal management executive.
REOs may be appropriate as comps, depending on the neighborhood. “There are markets where the entire market is distressed,” In other markets, there is a clear distinction between REOs and seller-owned properties.”
“The question is: Are the properties truly comparable or not?” This is where discernment is required. It’s about the experience, knowledge and competency of the appraiser.”
If you have some “traditional” sales within a mile radius that are comparable to your home in size and features, the appraiser should lean on those first. But all appraisals are subjective, so there are certainly no guarantees in today’s market. I recently had two independent appraisers appraise the same property and they came in 20% apart in their valuations, and that creates a lot of uncertainty and anxiety for Buyers and Sellers!
New Year Arcadia Sales
Latest Arcadia Real Estate statistics. Inventory levels had a slight increase, which would be seasonally expected as Sellers ramp up for the Spring “buying season”.
One thing to make note of is the wide discrepancy in the price per square foot between the average list and the average sales price.
See below!

Holiday Arcadia Stats!
Latest Arcadia area inventory and sales statistics. See below!
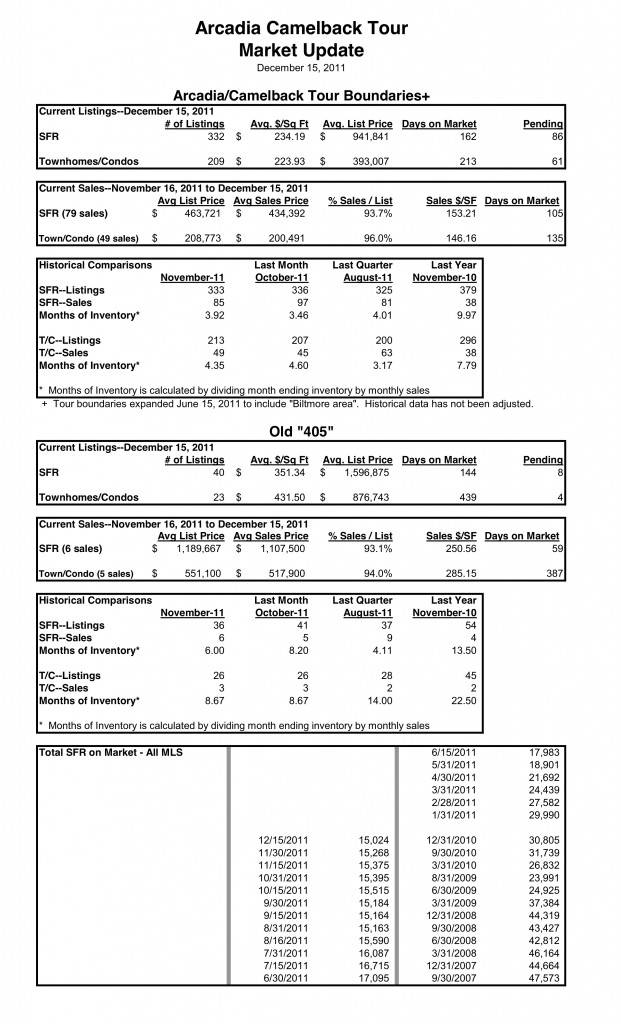 Latest inventory & sales staistics in the Arcadia area of Phoenix. See below!
Cromford Report Upbeat on Phx Market
Yesterday at the Arcadia Tour, Mike Orr of the Cromford Report spoke to the group about current trends in the Phoenix Housing Market. He provided us with many thoughts, facts and stats…and here are a few:
Here were his facts that the public currently believes to be true but in his opinion are false:
– A glut of Foreclosures overhang the market
– A new wave of foreclosures is coming
– Shadow Inventory is Big, Scary and Out to Get You!
– Prices are still declining
– Short Sales take forever and rarely close
– Renting saves money compared with buying a home.
All of the above are untrue as general terms and Mike Orr has the statistical analysis to prove it.
Supply vs. Demand:
Supply is down, so why aren’t prices rising? Mike’s answer: It happens eventually…usually it is 12-18 months before prices respond to a big change in supply and demand. The Phoenix market is currently at month 12, so in the next 6 months prices should start moving up.
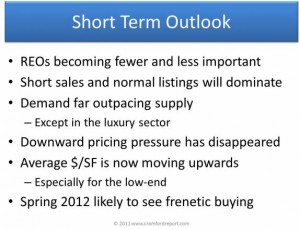 Listings by Distressed Type:
In the last 12 months, HUD & REO listings are down 70%; Short Sale listings are down by 73% and Normal Listings are down by 28%.
Listings by Price Range:
There is a short supply of homes listed under $250,000; a normal amount of listings in th e$250,000-$500,000; and a large supply of listings at $500,000 and up.
Price per Square Foot – All Areas & Types
Average List Price per Square Foot as of Nov. 13
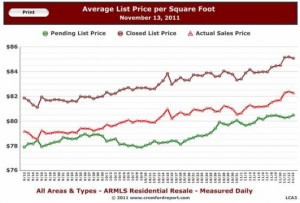
In the above chart the Red Line represents Sold price per SqFt; the Brown Line represents List price per SqFt; and the Green Line represents Pending price per SqFt. All three are moving in the same direction – UP – which is a good, strong trend. Mike Orr believes the bottom was in September.
Trustee Sales
Trustee Sales by Month for Maricopa County Single Family Residences
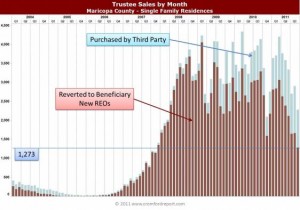
Looking at the above chart of Trustee Sales by Month, there are a few important things to note:
– The number of Trustee Sales in coming down sharply
– Almost half the trustee sales are purchased at auction – meaning, fewer properties are going back to the banks
– Since fewer properties are going back to the banks, the REO supply (number of Bank Owned Homes) could disappear very quickly.
– In addition, the Delinquency Rate for Maricopa County is decreasing
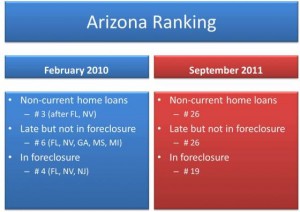
Arizona Ranking: February 2010 vs. September 2011 as compared to all US States
Arizona Ranking: Feb 2010 vs. Sept 2011
Listing Success Rate for Short Sales
Defined: Listing Success Rate is the percentage of listings that closed with a sale rather than expiring or being canceled. It compares the number of listings sold This Month with the number of listings that were sold, expired or canceled in the same period. This percentage gives a useful indication of what percentage of terminated listings closed successfully.
In January 2009, the Short Sale Listing Success Rate was less than 20%
In October 2011, the Short Sale Listing Success Rate was about 65%. ‘Normal’ Sale Listing Success Rate was about 75% and REO was about 95%.
Short Sales still have the lowest success rate, however, ALL listings are successful right now – as compared to the last 10 years. And, Short Sale Listing Success Rate is seen as about average.
Special Listing Conditions for Active, Pending and Sold
Active Listings: 10% are REO (which is down from previous month); 40% are Short Sale (which is the same as previous month); and 50% are Normal (which is on the rise!)
Pending: REOs are Down and Short Sales are becoming much more significant
Current Arcadia Statistics
Arcadia area inventory levels remain stable, although there are limited houses available in the mid-range. These homes, when they are listed, go fast if they are move-in ready. See below and notice a new column for sales prices per square foot.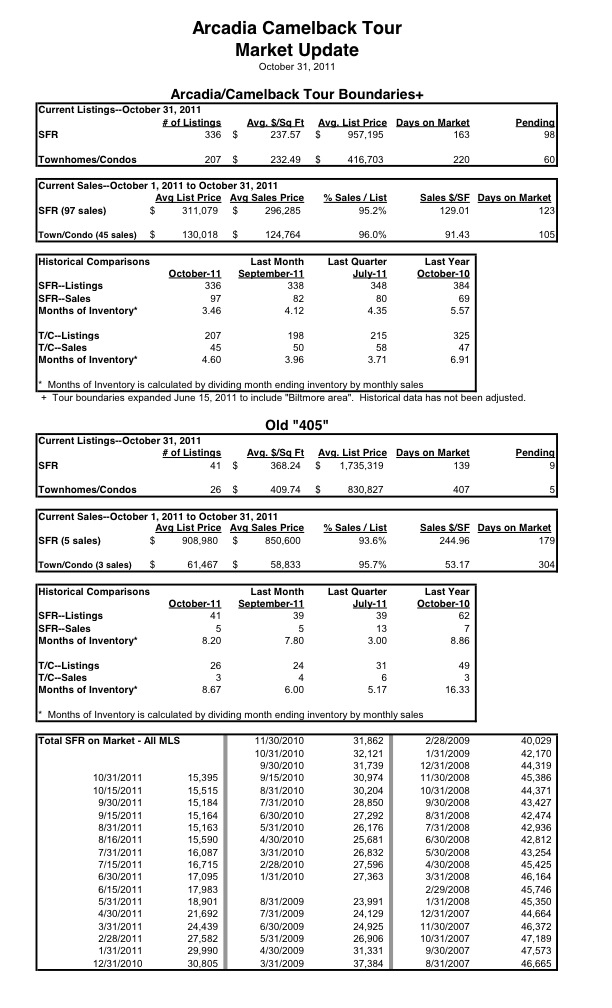
Arcadia Inventory
Below are inventory stats as of the end of September. Inventory levels in the tour area remain in a tight range, and the valley as a whole increased by only 20 homes. Please note, the valley inventory numbers of 4 years ago – over 47,000. Today we have just over 15,000 SFR homes on the market (32% of the levels from 4 years ago)!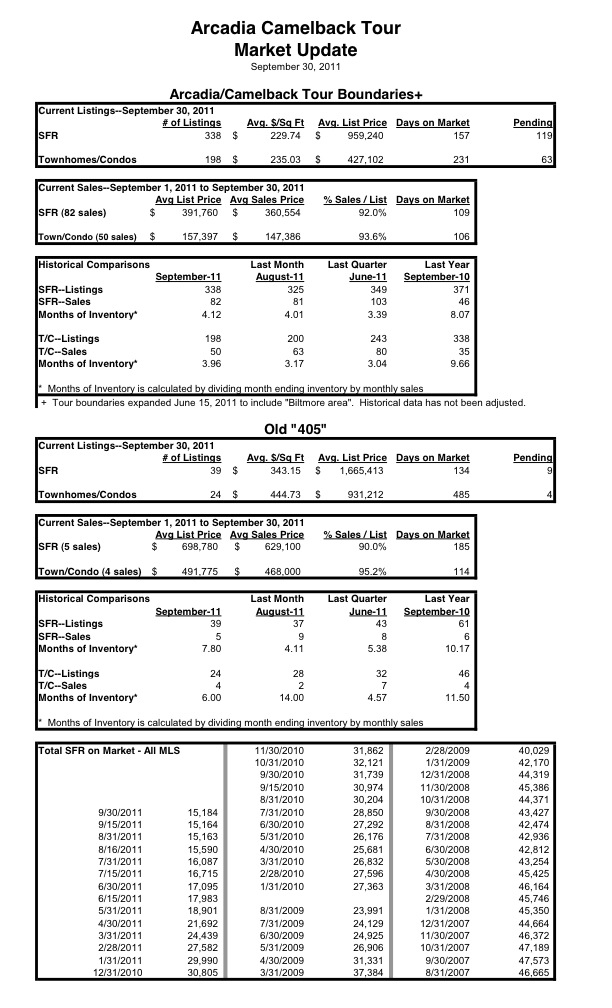
This Week’s Arcadia Stats
Inventory levels continue to drop overall in the MLS, (although only slightly this week), Still, the number of available detached houses is about half of what it was a year ago. Arcadia area inventory remains stable this week, but an unusual lack of available homes in Hopi School District in the the middle price ranges. See below!
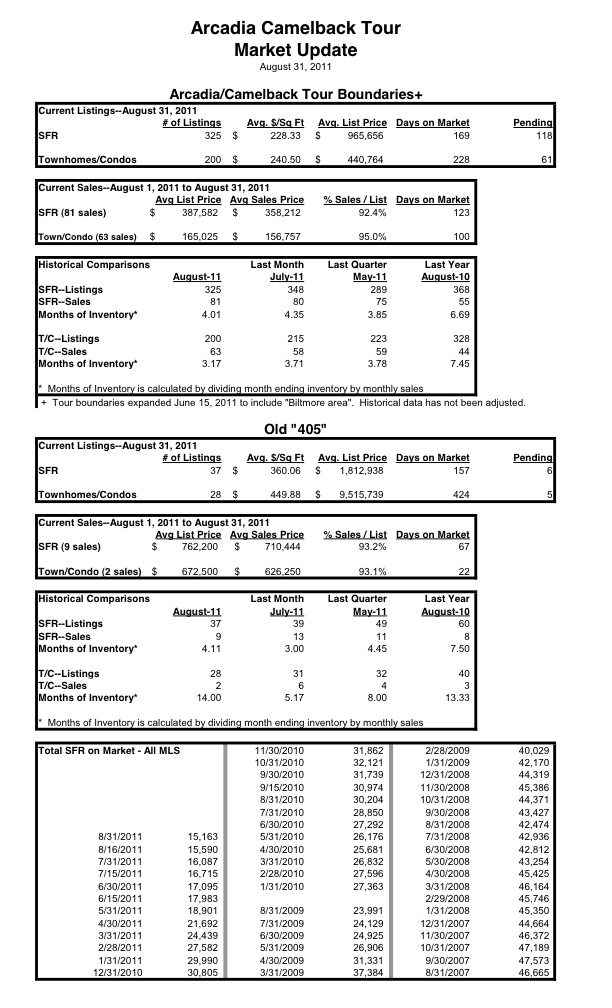
Latest Arcadia Area Stats!
Current Arcadia Area Statistics below,
Continued reductions in inventory across the valley, with a small uptick in the area. As I talk with Realtors, I hear the same story – there is a limited supply of homes when you back out the REO and short-sale listings.
The two types of homes I see selling are the houses that need tons of work yet are a great deal, usually a foreclosure or probate sale, and at the other end of the spectrum a pristinely remodeled home that is move-in ready is also selling. The homes on the market in between these two types seem to be a stagnant segment of the market right now.
See stats below!
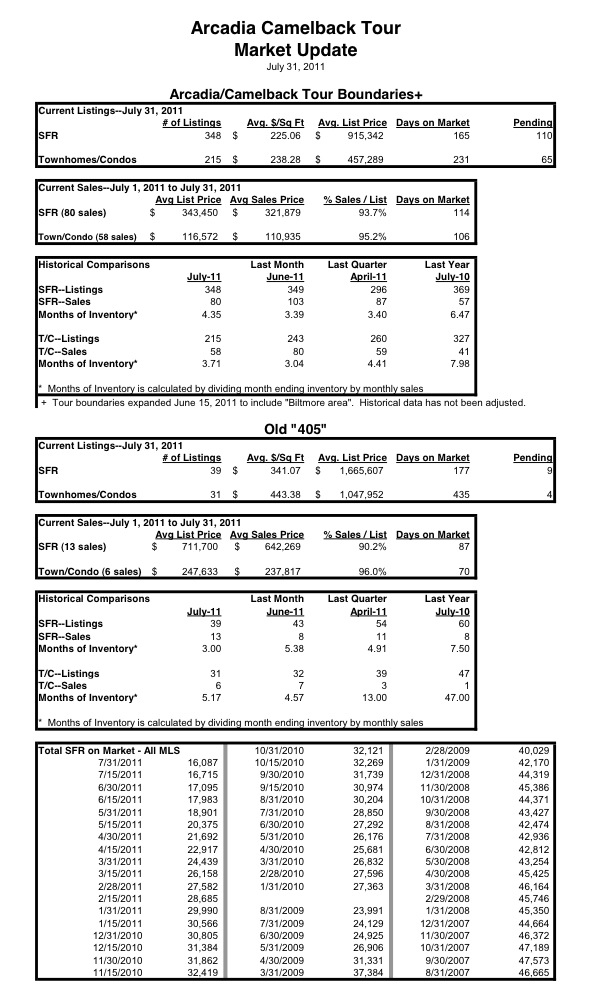
Area Inventory Levels
It’s surprising that this is not getting a little more press:
Listing inventory is dropping weekly, now down below 20,000, and only 16,000 of those Single Family Detached Homes. That trend continues every week. Only a year ago there were around 30,000 in the MLS.
Sales activity is on the rise, and rising every month. June was the best month in the Phoenix Metro area since 2005. That’s right, the best month in sales in 6 years.
Foreclosures, while still high, are slowing and the percentage of the market from June of last year dropped from 38% to 32%. And every month, the trend seems to show that the pace is decreasing by about 500 properties per month. And, the number of total licensees here in Arizona, and Realtors nationwide is dropping.
I have a few Buyers at the moment that literally can’t find something decent on the market in their price ranges, it wasn’t long ago that a Buyer had their pick of the litter.
No one can predict where we’ll go from here but the market has seen an interesting turn in the last few months in the central Phoenix metro area. See attached Arcadia Camelback Stats and related MLS stats below!
