Yesterday at the Arcadia Tour, Mike Orr of the Cromford Report spoke to the group about current trends in the Phoenix Housing Market. He provided us with many thoughts, facts and stats…and here are a few:
Here were his facts that the public currently believes to be true but in his opinion are false:
– A glut of Foreclosures overhang the market
– A new wave of foreclosures is coming
– Shadow Inventory is Big, Scary and Out to Get You!
– Prices are still declining
– Short Sales take forever and rarely close
– Renting saves money compared with buying a home.
All of the above are untrue as general terms and Mike Orr has the statistical analysis to prove it.
Supply vs. Demand:
Supply is down, so why aren’t prices rising? Mike’s answer: It happens eventually…usually it is 12-18 months before prices respond to a big change in supply and demand. The Phoenix market is currently at month 12, so in the next 6 months prices should start moving up.
 Listings by Distressed Type:
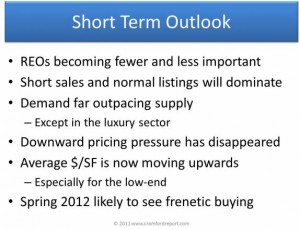
In the last 12 months, HUD & REO listings are down 70%; Short Sale listings are down by 73% and Normal Listings are down by 28%.
Listings by Price Range:
There is a short supply of homes listed under $250,000; a normal amount of listings in th e$250,000-$500,000; and a large supply of listings at $500,000 and up.
Price per Square Foot – All Areas & Types
Average List Price per Square Foot as of Nov. 13
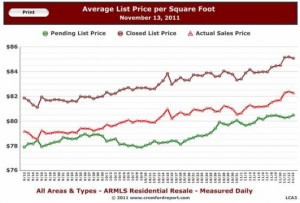
In the above chart the Red Line represents Sold price per SqFt; the Brown Line represents List price per SqFt; and the Green Line represents Pending price per SqFt. All three are moving in the same direction – UP – which is a good, strong trend. Mike Orr believes the bottom was in September.
Trustee Sales
Trustee Sales by Month for Maricopa County Single Family Residences
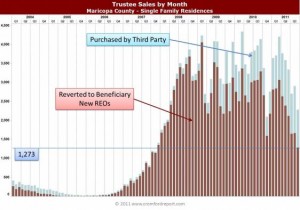
Looking at the above chart of Trustee Sales by Month, there are a few important things to note:
– The number of Trustee Sales in coming down sharply
– Almost half the trustee sales are purchased at auction – meaning, fewer properties are going back to the banks
– Since fewer properties are going back to the banks, the REO supply (number of Bank Owned Homes) could disappear very quickly.
– In addition, the Delinquency Rate for Maricopa County is decreasing
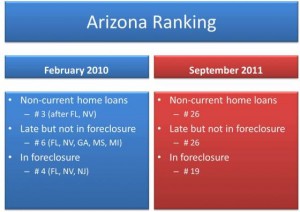
Arizona Ranking: February 2010 vs. September 2011 as compared to all US States
Arizona Ranking: Feb 2010 vs. Sept 2011
Listing Success Rate for Short Sales
Defined: Listing Success Rate is the percentage of listings that closed with a sale rather than expiring or being canceled. It compares the number of listings sold This Month with the number of listings that were sold, expired or canceled in the same period. This percentage gives a useful indication of what percentage of terminated listings closed successfully.
In January 2009, the Short Sale Listing Success Rate was less than 20%
In October 2011, the Short Sale Listing Success Rate was about 65%. ‘Normal’ Sale Listing Success Rate was about 75% and REO was about 95%.
Short Sales still have the lowest success rate, however, ALL listings are successful right now – as compared to the last 10 years. And, Short Sale Listing Success Rate is seen as about average.
Special Listing Conditions for Active, Pending and Sold
Active Listings: 10% are REO (which is down from previous month); 40% are Short Sale (which is the same as previous month); and 50% are Normal (which is on the rise!)
Pending: REOs are Down and Short Sales are becoming much more significant

